Actual Cash Flow: the system in brief

by: Ann Marie Svoboda
In today’s chaotic economy, efficient cash flow analysis is fundamental to managing a firm’s liquidity and protecting its opportunity for growth. The advanced finance team dynamically forecasts cash every day, positioning cash balances before breakfast and seamlessly mobilizing money before lunch. It is through such efficient processes that firms maximize the money multiplier and support an enhanced valuation.
Sure, that sounds fantastic. But these financial processes rarely exist in real life. Company-wide access to anything more than basic cash flow analytics is rare in the modern firm. Why?
I spent much of the ‘00s thinking about this, conducting exhaustive research to figure it out. This research led to writing my first book, Actual Cash Flow, which endeavored to synthesize the mechanics of cash positions and cash flows to provide a tool for management reporting called the Actual Cash Flow™ system. A summary of that descriptive methodology follows below.
Cash flow information provides incremental and valuable insight into the firm’s financial picture. In its most basic form, cash flow data is a practical tool to augment traditional financial reporting. But when structured with competence, the direct and nonmalleable nature of cash flow information is formidable in guiding efficiency, control, and communication throughout the firm.
The Actual Cash Flow™ system strives to clarify cash flow information while providing a basic structure for analysis and reporting of cash flow activity within the firm.
____________
The following edited excerpts from Actual Cash Flow: The Route Back to Basics in Corporate Finance introduce the Actual Cash Flow™ system and its form of direct cash flow reporting. These passages are summarized and only include sections pertinent to understanding the system’s reporting terminology and format.
First, a portion of Chapter 2 explores the components of cash flow that are found in the funds flow cycle, identifying the basics of how cash moves within the firm. Following is an excerpt from Chapter 4, which explains the basic construction of Actual Cash Flow™ reporting.
For more information, please visit www.actualcashflow.com.
____________
Excerpts from Chapter 2: Cash Flow, What Are We Trying to Measure?
Before the development of a cash analysis system can begin, cash movements within the firm must be delineated.A key reason the Actual Cash Flow™ system is needed is that true cash flow information is an elusive detail in the realm of financial accounting and control. Undoubtedly, many representations of cash flow exist, but the relationship of these interpretations to that of real cash flow is not usually clear. This is an obvious problem because, without an accurate picture of cash flow, cash flow analysis is flawed.
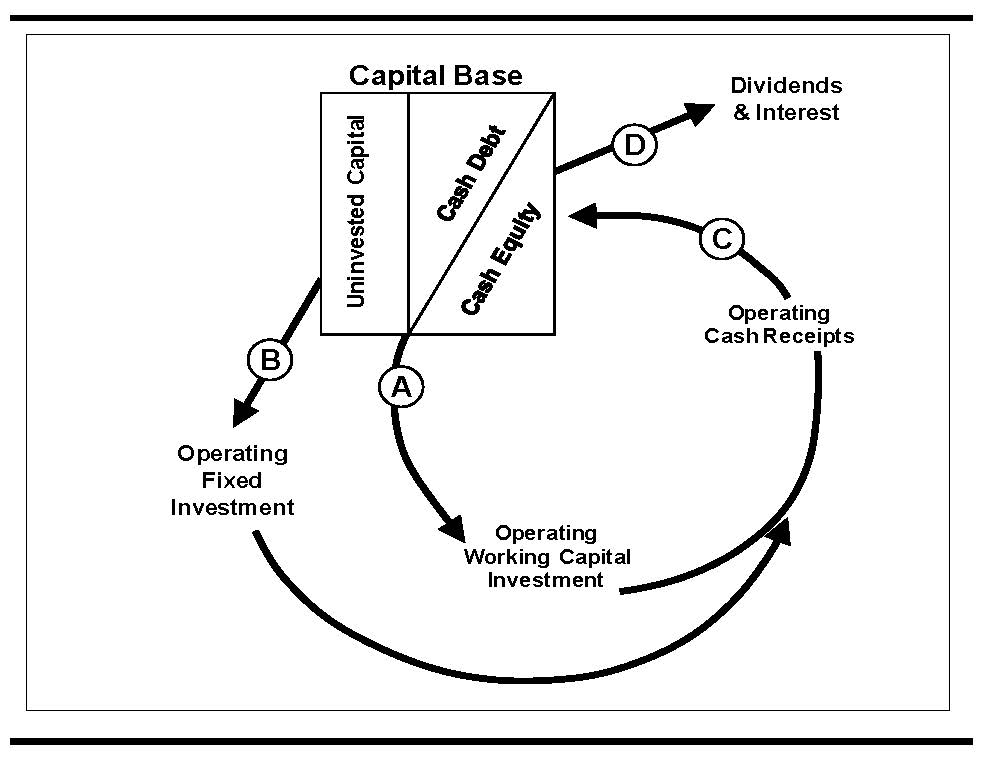
A depiction of the funds flow cycle appears in Exhibit 1. It is a simplistic diagram of cash moving in, around, and out of the firm and is a concise picture of the cash maneuvers a financial manager is trying to control. Through the funds flow cycle, cash either moves internally or to/from external parties. It is invested in operations, or it changes the construct of the capital base. These are basic concepts. And as a result, cash analysis is not an elaborate exercise. Yet, the misrepresentation of cash flow persists in modern finance.
Although cash flow information can be reduced to one net summation of cash inflows and outflows, this narrow perspective dilutes the interpretive insights available in cash flow information. A view of the distinct components of cash flow is preferred, but this is a less intuitive method. So some primitive guidance is necessary to explain the disparate pieces of cash flow. It is, then, within the distinct categories of cash flow that we begin to see the structure of the Actual Cash Flow™ system. The funds flow diagram, presented in Exhibit 1, guides this review.
Operating Outflows
Exhibit 1 depicts the basic movements of cash in and out of the firm and allows specific identification of cash flows. Each arrow dissects the funds flow cycle and labels cash flow categories, thereby assisting further discussion and analysis.
Exhibit 1 demonstrates that the operating funds flow cycle begins with a cash outflow from the capital base. This outflow takes place in one of two ways. Cash either enters the funds flow cycle using arrow A, the working capital route, or using arrow B as payment for long-term assets.
Let’s examine arrow A, which represents an investment of cash in working capital. Be careful here. Cash analysis does not necessarily follow the framework of accrual accounting. Within accounting, investment is recorded when there is either a cash outflow or the creation of a liability promising future cash outflow. In cash analysis, though, investment occurs only when money leaves the capital base (i.e., the check clears the bank) and not before. This simple idea is important for understanding the cash flows depicted in Exhibit 1.
In this context, the amount of cash invested in working capital is not the same as what is represented on the balance sheet. The traditional calculation for a firm’s working capital investment, equal to current assets less current liabilities, is inappropriate for cash analysis because it includes estimates of future expected cash flows related to profits that are earned but not yet received. In other words, future cash flows are incorporated into traditional working capital measures through the billed profit margin as part of accounts receivable and are therefore incremental to the real cash outflows related to working capital.
We can see that there is a clear distinction between the precision of cash information that is available within financial reporting and true cash flow. And since we are interested only in real cash flow activity, this description introduces new terminology for use within the Actual Cash Flow™ system. For our purposes, the cash outflow depicted by arrow A in Exhibit 1 is called Operating Working Capital Investment (OWCI).
OWCI is the gross cash outflow during any given period that occurs in payment for short-term operational utility. It includes disbursements for purchases of short-term assets (e.g., inventory), remittances related to firm activities that tender specific value (e.g., payroll), and payments for ancillary costs of doing business (e.g., insurance premiums and taxes).
On the other hand, arrow B represents cash payments for assets or activities designed to create long-term value. Examples of these investments are cash payments for fixed assets, development costs, acquisitions, and other long-term resources. The term for this outflow is Operating Fixed Investment (OFI).
Together, OWCI and OFI encompass the firm’s cash payments incurred to run the business. For most firms, the primary difference between payments relating to OWCI and that of OFI is the nature of the cash outflow’s relationship to cash inflow. If a cash outflow has a repetitive quality relevant to near-term operational inflows, the outflow is probably an OWCI. For instance, a retail store’s payments for a season’s inventory relate to their near term sales, qualifying the associated vendor payments as OWCI. Alternatively, a manufacturer’s research and development costs surrounding new product development relate to potential sales that could persist for many years into the future, which qualifies the cash outflow as OFI.
Regardless of the category of outflow, though, cash payments will not last indefinitely without cash inflows.
Operating Inflows
The tail end of the operating funds flow cycle is represented in Exhibit 1 by arrow C, which is the gross operating cash inflow to the capital base. This cash flow is termed Operating Cash Receipts (OCR). It consists of all cash inflows related to current and future accounts receivable, including cash applied against open invoices, payments on written-off accounts, unapplied cash, and unearned revenue; all cash received upon the sale of long-term assets; and the gross amount of all other operationally generated cash inflows such as vendor rebates received for volume purchases.
It is OCR that contain not only the return of OFI and OWCI to the capital base but also the incremental gains on that investment. These excess inflows are the key to a firm’s existence, as they are the cash profits—the ultimate purpose of all business activity.
The above interpretation of the funds flow cycle, so far, has involved distinct categorization of cash activity into OWCI, OFI, or OCR. Unfortunately, the classification of cash flow is frequently situational, and intricate transactions can have overlapping consequences in the identification of specific receipts and disbursements. Chapters 5 and 6 of Actual Cash Flow discuss some of these complex circumstances, thereby preparing the reader for using Actual Cash Flow™ in a real firm. We will restrict this discussion to general cash flow activity, though, so that we can cover the basics with confidence.
The Capital Base
The final component of the funds flow cycle involves cash flows and balances that are pertinent to the Capital Base, which, as depicted in Exhibit 1, is organized into three components: Cash Debt, Cash Equity, and Uninvested Capital. Although the Capital Base is purposefully separate from the operating sequence of cash flow, it should not be considered a subordinate category. It will soon be clear that without a representation of the Capital Base, OWCI, OFI, and OCR have little foundation for interpretation.
It is important to note that the analytical approach to the Capital Base is different from that seen so far, because the three categories represent balances and not a cash flow. In other words, proper analysis of the Capital Base starts with a representation of the gross cash-based principal amounts of each component. It then incorporates the existence of cash flows that interact with, increase, or decrease those balances. When attempting to build this portion of an Actual Cash Flow™ analysis, know that an indication of the starting Capital Base measurements might be available in the details of the balance sheet because the initial book value of Capital Base items is frequently logged on a cash basis. But be careful, because differences between the historical book value and the currently recorded value, possibly adjusted to fair market value, often exist. These variances are only relevant to cash flow analysis if they resulted in previous cash flows.
The first element of the Capital Base is Cash Debt. Through Cash Debt, firms acquire principal amounts of cash from lenders and pay interest on that principal over a specified period before repaying or refinancing the quantities borrowed. The principal balances of Cash Debt are often easy to decipher on a firm’s balance sheet, as they are commonly equal to the combination of the current and long-term debt categories. However, in some cases, financial debt is not included in the consolidated statements and may be carried off-balance sheet. Or the book value of some debt may be adjusted for interest, fees, premiums, or discounts. For that reason, the Actual Cash Flow™ analyst may need to dig deeper.
One alternative method for calculating the Cash Debt balance is to isolate the cumulative, non-equity cash contributions that entered the Capital Base and were not attributable to the operating funds flow cycle or income from Uninvested Capital. Another approach involves the identification of outstanding principal balances on all non-operating capital transactions that specify a minimum return (e.g., interest payments) and mandatory settlement terms on the principal amounts. All of these methods will help to identify the existing cash-contributed principal amount of debt, herein referred to as Cash Debt, at the Capital Base.
The other primary component of the Capital Base is Cash Equity. The cash value of outstanding equity, herein referred to as Cash Equity, equals the initial gross cash received by the firm at the times when shares were issued less any cash paid to repurchase any such shares. Within financial reporting, this equals the combined par value of each class of outstanding stock plus either premiums less discounts incurred at issuance or plus any additional paid-in capital or discount. When computing the balance of Cash Equity, it is also necessary to incorporate net cash sums paid or received for the purchase or sale of treasury stock. Treasury stock acts as equity capital that is not available to invest in the firm, so it works to decrease the net balance of Cash Equity at the Capital Base.
The third part of a firm’s Capital Base is referred to as Uninvested Capital. This category includes all balances of cash, cash equivalents, marketable securities, and other financial investments that are not invested in the operations of the firm. The Uninvested Capital balance is unique to the rest of the Capital Base. It is more of a stopover for cash between the true Capital Base (Cash Debt plus Cash Equity) and the cash invested in the firm’s operations. As such, be careful of your representation of Uninvested Capital, because it is possible to inappropriately misinterpret the gross amounts of cash invested in a firm.
Similarly, take care to distinguish between Uninvested Capital and cash balances that exist in the firm as part of operations. For example, funds invested in trust vehicles in support of defined benefit plans are endowments that contributed toward the maintenance of human capital. As such, these funds are part of the operating funds flow cycle and are not an element of the Capital Base (Chapters 5 and 6 discuss complex balances and transactions in greater detail).
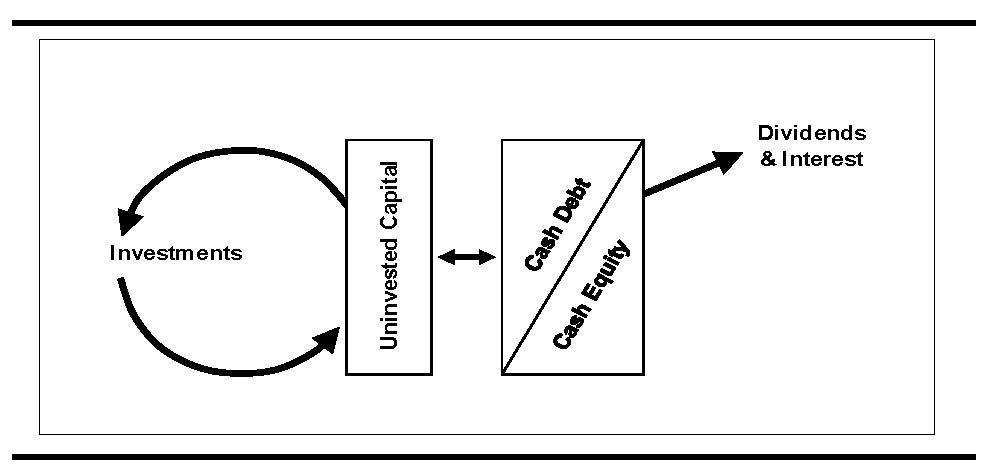
Note that the Uninvested Capital balance has its own set of cash flows, which is distinct from the rest of the Capital Base. The Uninvested Capital component of the Capital Base can be described using a separate funds flow cycle. See Exhibit 2 for an illustration. This discrete cycle includes cash outflows to purchase new financial instruments, cash inflows from interest and dividend income, and cash inflows from proceeds on the sale of outstanding Uninvested Capital balances. Remember, though, that none of this activity happens in consort with the operating funds flow cycle. Movements of Uninvested Capital exist only within the Capital Base.
Interest, Dividends, and Economic Income
A complete analysis of the firm’s Capital Base also includes cash flows associated with the preservation of the Cash Debt and Cash Equity balances. This activity incorporates all ancillary cash outflows related to the initial acquisition of debt and equity capital and the cash-funded maintenance costs of that capital. These payments of issuance fees, dividends, and interest deserve further explanation.
Exhibit 1 is a confined picture of the funds flow cycle and traces the cash transactions executed by the firm during a specified period. In this context, the net amount of OCR less OWCI and OFI equals the cash-realized economic income for that period. This net cash produced by (or, if the net amount is negative, then invested in) the operating cycle is hereafter referred to as Net Operating Cash Received (NOCR). Intuitively, NOCR is an essential figure to cash analysis because it is the realized, operating return currently available to either distribute to stakeholders or reinvest in the firm.
NOCR is the primary source of funds available to pay interest and dividends. In other words, NOCR is used to cover the cash-based cost of capital (illustrated by arrow D in Exhibit 1). If NOCR is insufficient to meet cash payments for interest and dividends, an influx of new capital or existing Uninvested Capital is required to cover the shortfall. The magnitude of NOCR in comparison to required interest and dividends holds immediate consequences for the quantification of leverage. And as interpreted through the quantity of excess NOCR over interest and dividends, we see a relationship to liquidity through the amounts of funds available for reinvestment. As a result, the stream of periodic NOCR has direct implications for the profitability, value, and stability of the firm.
This illustration of cash movements and capital balances covers the total funds flow cycle. Initial firm investment is represented by the principal balances of Cash Debt and Cash Equity, which anchor the Capital Base. This capital then enters the operational funds flow cycle through OWCI or OFI that then produces OCR. The net result culminates in NOCR, which is then used to fund interest and dividends, is reinvested in the operating funds flow cycle, or is held in Uninvested Capital as a peripheral component to the Capital Base. Complex transactions can sometimes overlap multiple elements of this outline and cause complication, but distinct segregation of cash information is surely possible.
The next section, an excerpt from Chapter 4 of Actual Cash Flow™, provides practical guidance on the applications of this cash information into a form of direct cash flow reporting.
Excerpts from Chapter 4: The Cash Flow Report
It is time to build an Actual Cash Flow report. The easiest way to start this process is to concentrate on activity for one isolated day.The Basic Report
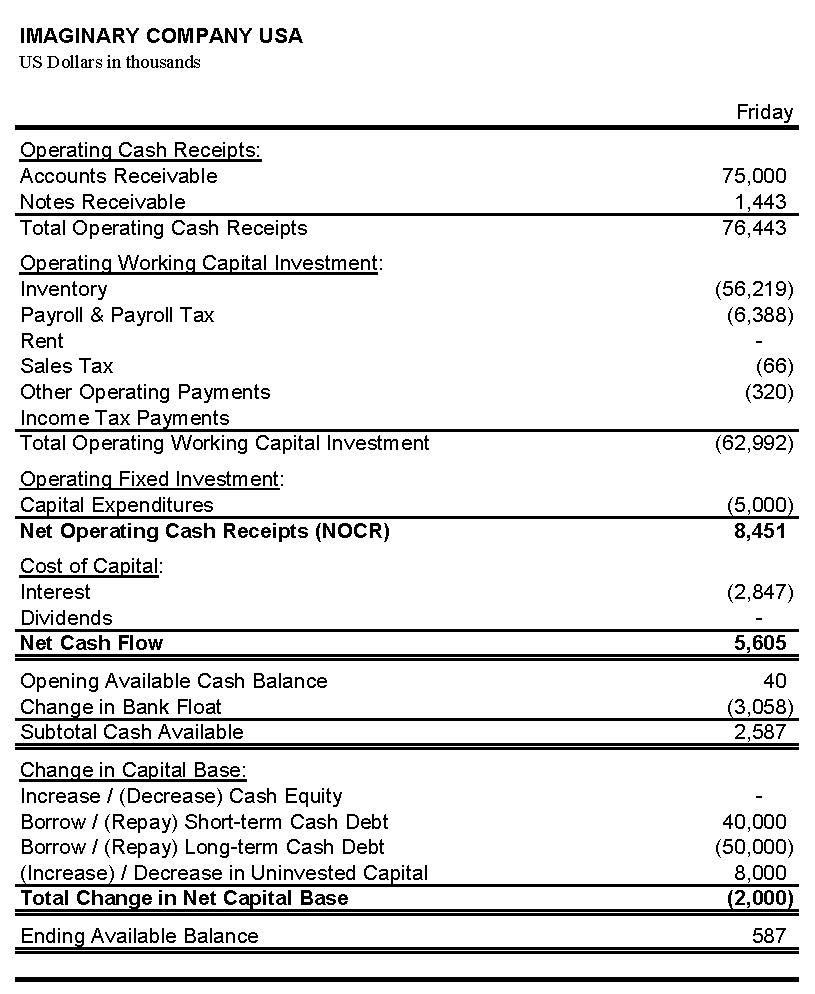
A sample basic Actual Cash Flow report for Imaginary Company USA appears in Exhibit 3. The analysis starts with the categories of OCR, OWCI, and OFI to determine NOCR for the day, followed by executed cost of capital payments to calculate a net cash flow figure.
These line items represent the heart of the report. This cash flow is where the culmination of NOCR occurs and is, therefore, the primary activity that influences the firm’s profitability, value, and stability.
Before we continue, it is important to note that details available for this part of the schedule, such as the presentation of inventory, payroll, and rent cash flows, are contingent upon the firm’s needs. The appropriateness of specific itemized line items within OCR, OWCI, and OFI depends on the function of that cash flow and the usefulness for interested parties within the firm.
The net cash flow figure, shown as $5,605 thousand in Exhibit 3, is followed by a mechanical interpretation of its effect on the consolidated available cash balance. This section of the report begins with disclosure of the day’s opening available cash balance and includes the day’s change in “float.” The summation of these amounts equals the day’s ending available cash balance.
The term “float” might need explanation in this context because it influences the firm’s cash flow and cash position. Float is the name assigned to a delay in liquid availability of funds and can impact activity within any section of the cash flow cycle. (The book provides a more detailed explanation of float.)
The bottom portion of Exhibit 3 incorporates the day’s impacts of NOCR and net cash flow on the Capital Base. A simple capital structure is used in this example, in which Imaginary Company manages its cash position by adjusting balances in short- and long-term Cash Debt and Uninvested Capital.
Notice that the report ends with a summation to the ending available balance. This figure represents the end-of-day available balance in Imaginary Company USA’s bank account(s). Again, this presentation can change, conditional on management’s objectives. For instance, because the ending (and opening) available balance is technically a part of Uninvested Capital, the separate listing can be eliminated and incorporated into the change in Uninvested Capital entry. For our purposes here, though, a segregated listing of the ending available balance assists the continuity of a running daily cash flow report.
Daily Cash Reporting
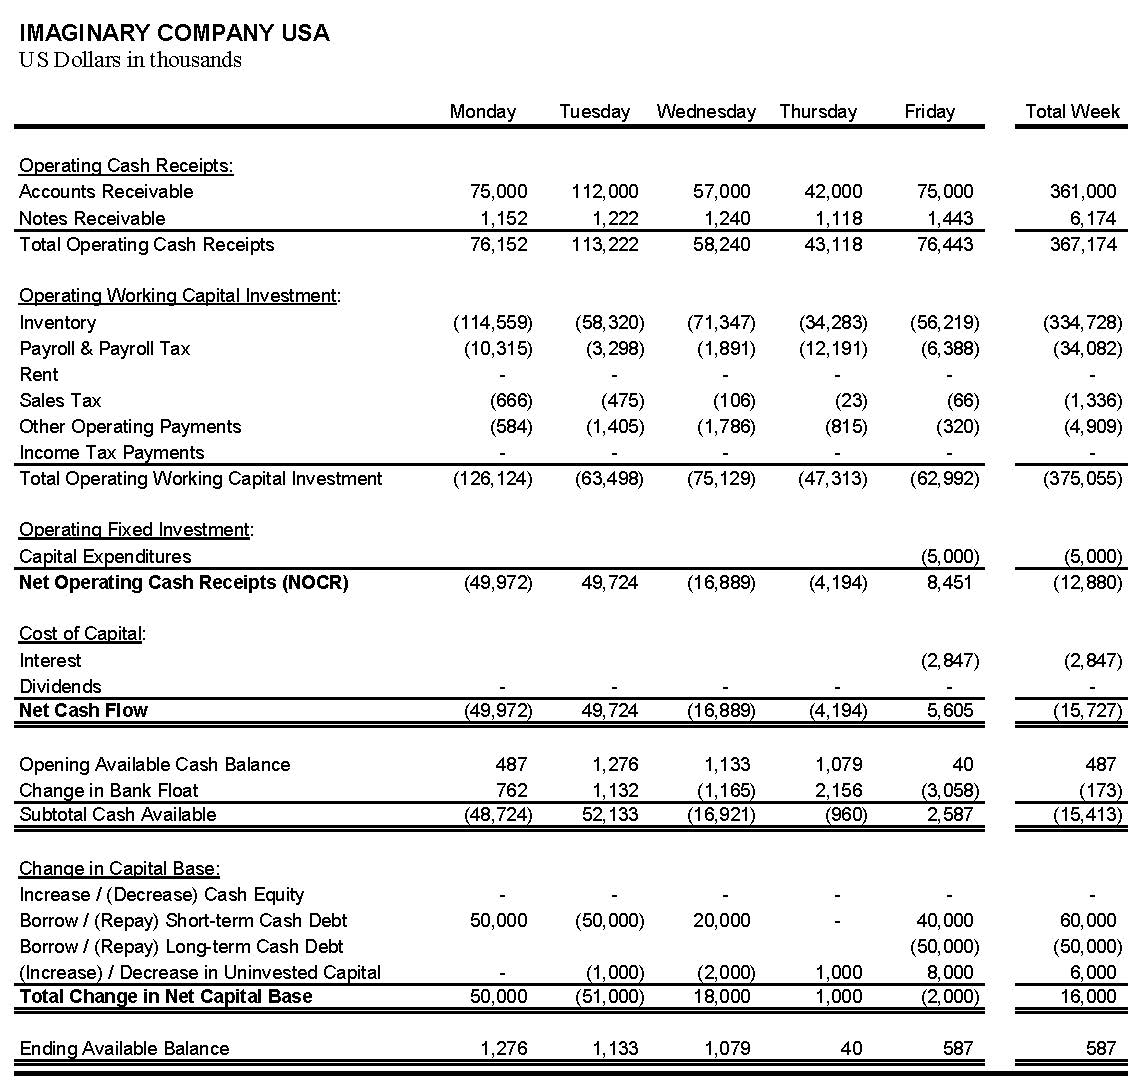
After creating a satisfactory cash flow report for one sample day, it is time to expand the analysis. First, add more days of cash activity, concentrating on the weeks and months surrounding the initial day. Be careful to maintain attention to detail at this point because new types of transactions will appear that were not present in your original single-day report. A sample design appears in Exhibit 4, presenting one of Imaginary Company USA’s business weeks. Note that the opening and ending balances help to guide the flow and verify the accuracy of the report.
Patterns emerge with this added detail. For example, Exhibit 4 suggests that Imaginary Company USA pays interest on Fridays. It also appears that the firm manages its cash position by adjusting short-term Cash Debt in increments of $10 million and Uninvested Capital in increments of $1 million daily. Material modifications to the overall capital structure, then, are made between short-term Cash Debt, long-term Cash Debt, and Uninvested Capital on Fridays.
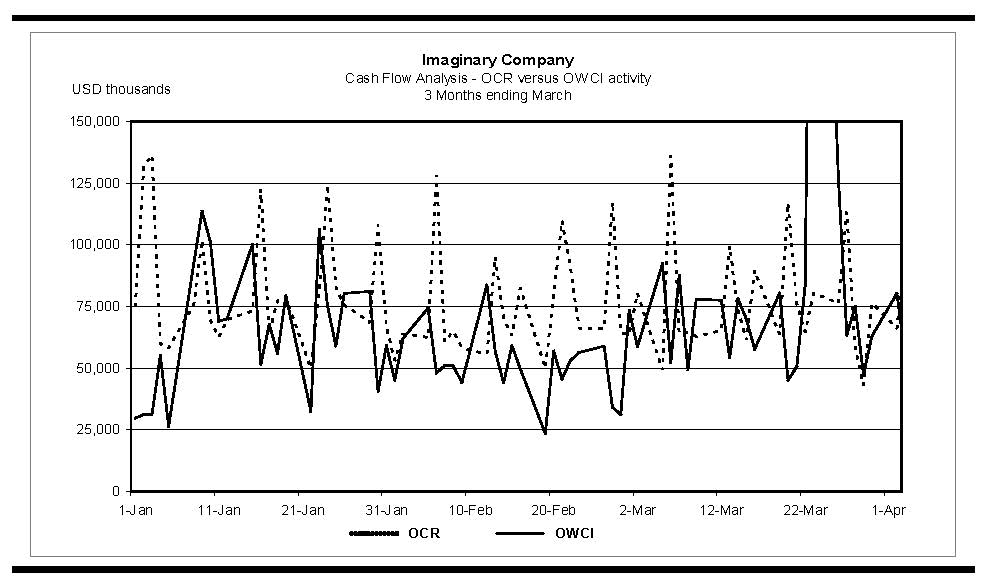
Of further significance, though, are the inter-day cash flows within the operating funds flow cycle. Observe the material cash flows on Monday versus Tuesday. Monday’s NOCR is a negative $50 million, while Tuesday’s is a positive $50 million. This disconnect results in borrowing $50 million for one day to cover the temporary cash shortfall. Assuming a 5% interest rate, this unsynchronized operating cash flow costs the firm $6,944 in interest for the day (calculated as $50 million multiplied by 5% divided by a 360-day base). But this is not an isolated expense. What if this exercise happens every week? Further analysis of the daily cash flow patterns across multiple weeks verifies the repetitive nature of this situation, as is shown in a graphical depiction (Exhibit 5) of daily OCR and OWCI for the three months ending March. A weekly $6,944 of avoidable interest expense produces a cumulative negative impact on available cash.
The continuation of uncoordinated cash flow not only costs Imaginary Company USA unnecessary interest expense each week, but it requires excess capital availability. This credit need, in turn, restricts investment, because the requisite capacity becomes permanently allocated to the weekly, one-day cash shortfalls instead of consistent OFI or OWCI supporting growth. It is possible that the weekly cash flow anomaly also mandates higher borrowing capacity within corporate loans than would otherwise be required, causing substantial expense related to upfront and other loan facility fees.
This observation serves as an ideal example of the significance of the Actual Cash Flow™ system for daily internal financial management. Within traditional financial analysis, the funds flow cycle is analyzed using balance sheet information that is only available intermittently, such that visibility to inter-day inefficiencies are minimized or obstructed. Through Actual Cash Flow™ analysis, though, precise calculations of the costs associated with uneconomical asset management and administrative processes are transparent.
For more information about the Actual Cash Flow system, please visit www.actualcashflow.com.
Opening Cover Image: ©corund - stock.adobe.com
Internal charts, reports, and graphs: ©Blackworth Publishing LLC
