Corporate Finance and the Art of Explanation

by: Ann Marie Svoboda
February 25, 2019
If you work in corporate finance, you know it’s easy to get lost in a sea of numbers. You spend your days wading through reconciliations and mapping variances that are full of numbers. And on any given day, if you’re good at your job, your reconciliation is clear and concise. Your variance analysis may even be transformed into a walk. If you’re a great analyst, your presentation even explains why the variances exist. But only if you’re an exceptional financial professional, do you skip the obvious and get to the point.
The Point can encompass a multitude of dimensions, but those dimensions generally pivot on a few key questions. First, The Point will always answer what specific operational action (or inaction) caused the variance. I like to call this The What.
Often, though, specific operational variance descriptions are not enough. In these instances, The Point will also answer The What Else. In the case of negative variances The What Else answers questions such as “why didn’t we see this coming” and “what are we doing to ensure this doesn’t continue?” Or in the case of positive variances, The What Else may need to explore “how do we keep this going” or even “what’s the opportunity for more?”
Answering these questions is the key to being an exceptional financial professional. The exceptional get to The Point.
But this is not so easy. We are finance people. For most financial professionals, it’s easy to get lost in the numbers, because we like numbers. Most of us love big models and complex formulas. And so, once we distinguish the variances and dissect the pieces of those differences, it seems like the story is over. We feel like we’ve answered our questions. We understand the numbers. And it’s then that we forget our audience.
We forget that most audiences don’t care so much about the numbers. Most audiences only want key points and final answers. This means that, no matter how long you spend studying and decoding financial data, your work is useless if you can’t quickly and effectively explain the numbers to the intended audience. You have to get to The Point. And you can’t get to The Point if you don’t answer The What and The What Else.
Beyond the obvious (where I plan to write many blog posts on “knowing your audience”), answering The What and The What Else requires visibility outside your own numbers. If you’re analyzing revenue, you need to talk to the sales teams. If you’re analyzing cash flow, you probably need to talk to purchasing and credit. You need to know the competition and if they face the same risks as your own company. You need to know what’s in the innovation pipeline and how that plan fits with the market’s dynamics. And the list goes on. The list of what you need to know, in fact, could be infinite.
But here is where your finance skills kick in. You don’t always have to look to the possibilities of the infinite. You know what the variances are, so you can focus on what matters. This is where you get to The Point.
I raise an example in my recent book, Cash Flow Analysis. In Chapter 3 of Cash Flow Analysis, the book discusses patterns of how cumulative operating cash flow is not equal to cumulative operating profit over time. In a specific example, shown in the exhibit below, anomalies are apparent in the identified differences between cumulative cash- and accrual-based operating profits. The bottom shaded area represents the cumulative operating cash flow for a 3-year period. Then, the black shaded area represents the net change in fixed assets (related to approximately $300 million of annual capital expenditures with an increase to approximately $400 million in Year 3), and the top shaded area presents cumulative uncollected revenue. The combination of these components equals the accumulation of the firm’s operating income during the 3-year period.
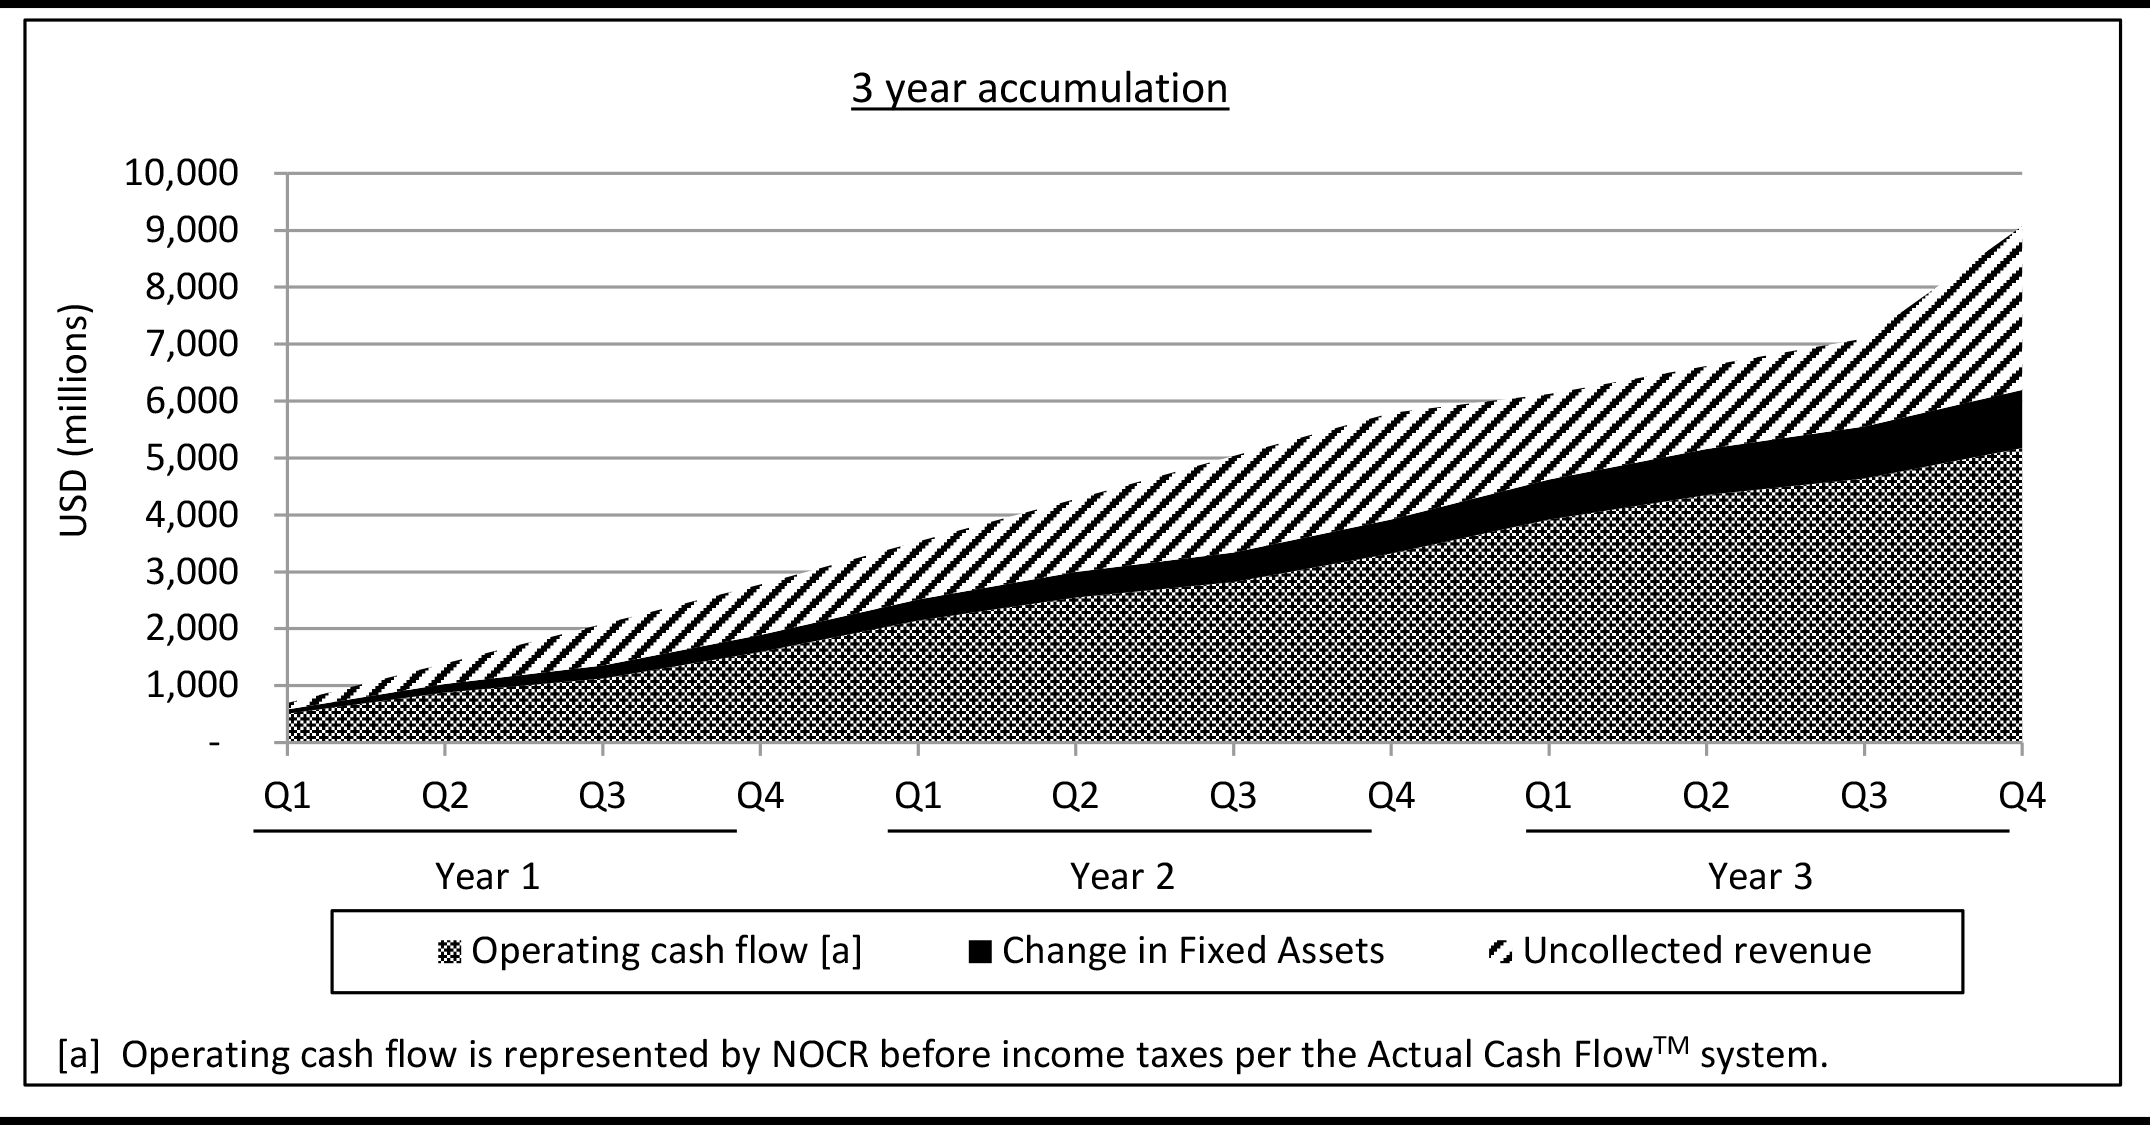
This chart is useful in depicting the seasonality of cash flow in relation to income. We see that the primary difference between operating cash flow and operating income over time, in this example, relates to uncollected revenue. It is clear that collections lag accrued revenue over the initial fiscal quarters.
The exhibit includes an anomaly at the end of Year 3 where incremental accounts receivable remain uncollected. This is a sample disparity that should prompt further review, or rather is where we consider The What. What is the accounts receivable increase related to? Was there more than one customer’s receipt underlying the anomaly? And once those questions are answered, we turn to The What Else. For example, will the difference reverse during the next period, because it relates to past due receipts? Or is the difference a predictor of future variances, where the firm has begun to grant excess credit terms to all of its customers?
Here is a perfect opportunity to get to The Point.
When describing Year 3 Free Cash Flow results as portrayed in the exhibit, a statement that gets to The Point would include specifics such as: “Free Cash Flow grew 12% in Year 3 versus 17% growth in Year 2. The 5% decrease relates to a strategy to increase market share through enhanced customer credit terms. This strategy supported consistent 9% growth in Operating Income that is expected to continue into Year 4.”
The exhibit, which is essentially a reconcilement exercise, offers pictorial direction on where the differences between income and cash flow reside. The leap to then be able to explain those differences requires further cognitive consideration. Recognizing that the variance relates to accounts receivable is particularly useful. But here, an understanding of accounts receivable in the context of cash flow along with knowledge of the company’s credit strategy is essential.
Inferior analytical communication would simply point to an increase in working capital as an explanation for declining cash flow. But in getting to The Point, the explanation reveals the specific actions behind the variance. The above example includes commentary on strategy, connecting the identified variances in cash flow results to operational activity. The Point is that the variance “…relates to a strategy to increase market share through enhanced customer credit terms. This strategy supported consistent 9% growth in Operating Income that is expected to continue into Year 4.”, which provides guidance that is actually useful to the audience.
So here is the challenge to all corporate finance professionals. If you strive to be exceptional, ask The What and The What Else. Pull your focus from the pure numbers and get to The Point.
Blog Image: ©Myimagine - stock.adobe.com